Let's talk about SexiGraf
I was introduced to SexiGraf by Eric Bussink during a roundtable at the April London VMUG meeting. The room was divided into those who said “Oh yeah, SexiGraf, it’s awesome” and those, like me, who hadn’t yet discovered it.
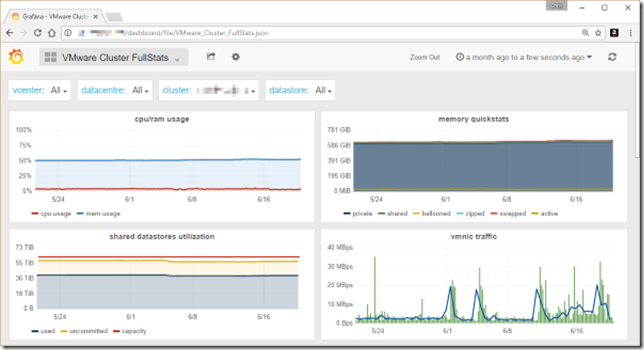
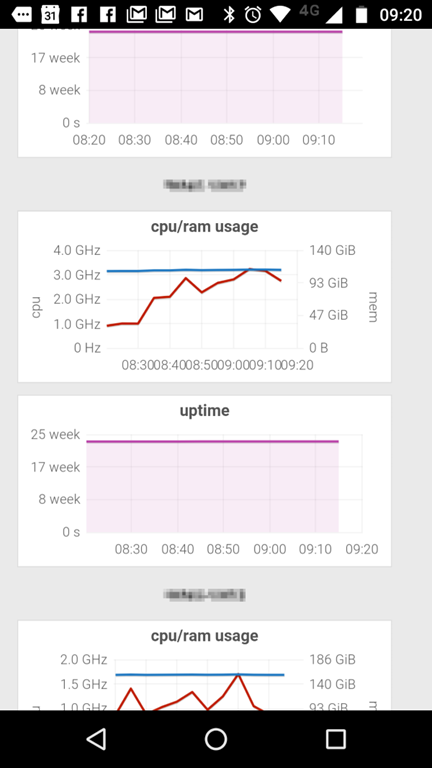
SexiGraf is a free community tool that creates some great (you might even say sexy) graphs based on vCenter statistics. Whilst it might not have all the bells and whistles of the big commercial monitoring solutions it does provide a neat, easy to use, web-based interface to get at those important headline figures and how they’ve changed over time.
Installation is straightforward and well documented- SexiGraf deploys via an OVF template to the Virtual Infrastructure and connection to vCenter just requires a read-only vSphere credential to be provided. Updates are quick and easy too as a simple patch package can be uploaded via the web admin interface and the server patched in minutes without any loss of history.
Having run this myself for just a couple of months I can already see the benefits both from a capacity planning point of view but also when troubleshooting- “is this host using resources differently to others?” or “is the cluster usage different to normal?”.
As well as the vSphere statistics, SexiGraf is continually expanding it’s range. VMware vSAN, Windows, and FreeNAS connectivity is all offered and HP C7000 and S.M.A.R.T counters are under development.
If you haven’t yet discovered it, I’d recommend having a look. Downloads and full details are here- https://www.sexigraf.fr/